Tag: mobile performance

Core Web Vitals and Web Performance Strategy: A Reality Check

Google’s Core Web Vitals initiative has become a larger part of discussions that we have with customers as they begin setting new performance KPIs for 2021-2022. These conversations center on the values generated by Lighthouse, WebPageTest, and Performance Insights testing, as well as the cumulative data collected by CrUX and Akamai mPulse and how to use the collected information to “improve” these numbers.

Google has delayed the implementation of Core Web Vitals into the Page Rank system twice. The initial rollout was scheduled for 2020, but that was delayed as the initial disruption caused by the pandemic saw many sites halt all innovation and improvement efforts until the challenges of a remote work environment could be overcome. The next target date was set for May 2021, but that has been pushed back to June 2021, with a phase-in period that will last until August 2021

Why the emphasis on improving the Core Web Vitals values? The simple reason is that these values will now be used as a factor in the Google Page Rank algorithm. Any input that modifies an organization’s SEO efforts immediately draws a great deal of attention as these rankings can have a measurable effect on revenue and engagement, depending on the customer.

While conversations may start with the simple request from customers for guidance around what they can do to improve their Core Web Vitals metrics, what may be missed in these conversations is a discussion of the wider context of what the Core Web Vitals metrics represent.

The best place is to define what the Core Web Vitals are (done by Google) and how the data is collected. The criteria for gathering Core Web Vitals in mPulse is:

Visitors who engage with the site and generate Page View or SPA Hard pages and are using recent versions of Chromium-based browsers.

However, there is a separate definition, the one that affects the Page Rank algorithm. For Page Rank data, the collection criteria gets a substantial refinement:

Visitors who engage with the site and generate Page View or SPA Hard pages who (it is assumed) originated from search engine results (preferably generated by Google) and are using the Chrome and Chrome Mobile browsers.

There are a number of caveats in both those statements! When described this way, customers may start to ask how relevant these metrics are for driving real-world performance initiatives and whether improving Core Web Vitals metrics will actually drive improvement in business KPIs like conversion, engagement, and revenue.

During conversations with customer, it is also critical to highlight the notable omissions in the collection of Core Web Vitals metrics. Some of these may cause customers to be even more cautious about applying this data.

  • No Data from WebKit Browsers. None of the browsers based on Webkit (Safari, Mobile Safari, Mobile Safari WebView) collect Cumulative Layout Shift or Largest Contentful Paint values. Recent updates have allowed for the collection of First Contentful Paint, but that is not one of the metrics used in Core Web Vitals. The argument can be made that Safari and Mobile Safari already deliver highly optimized web experiences, but not providing insight into a significant (if not dominant) user population will leave organizations wondering what global performance metrics (i.e., metrics collected by all browser families) they can use to represent and track the experience for all visitors.
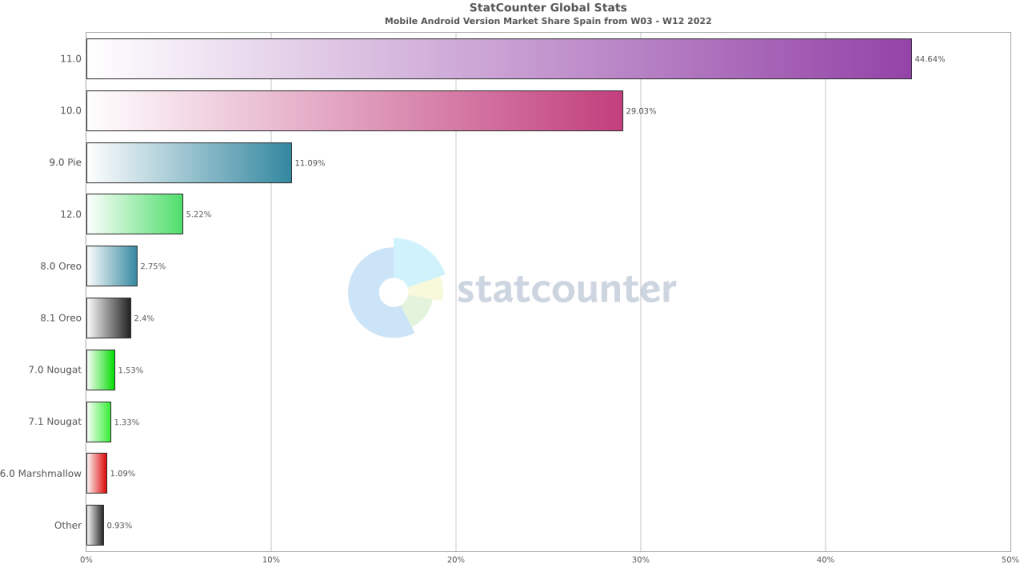
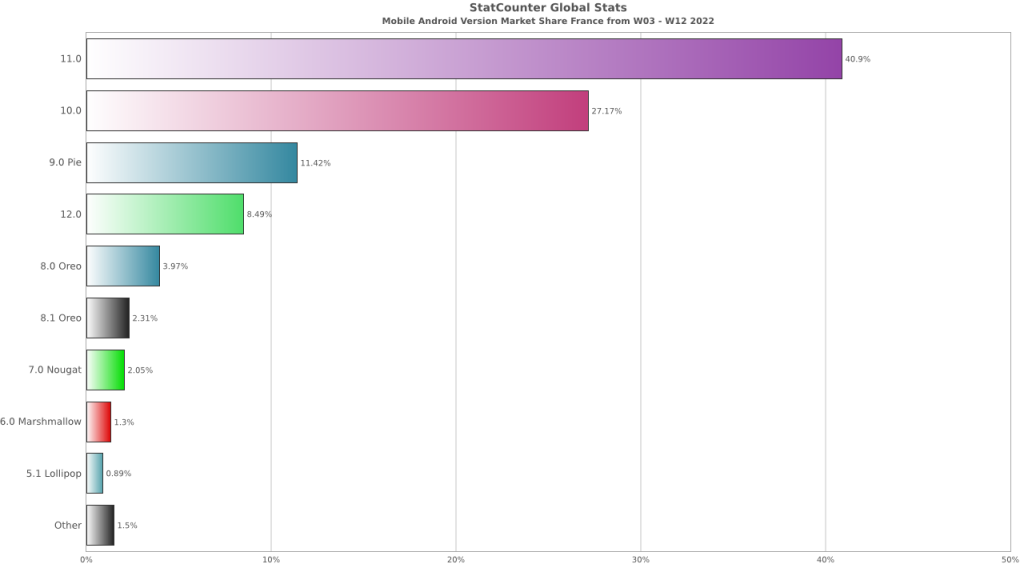
  • Limitations in CrUX Data Collection. The data that Google collects for CrUX reporting only originates from Chrome and Chrome Mobile browsers. So, even though Chromium-based browsers, such as Edge and Opera, currently collect Core Web Vitals data, it is not used by Google in Page Rank. This narrow focus may further erode the focus on Core Web Vitals in organizations where Chrome and Chrome Mobile are only one part of a complex browser environment.
  • Performance Delta between Mobile Safari and Chrome Mobile. With only very limited exceptions, Mobile Safari substantially outperforms Chrome Mobile in standard performance measurement metrics (Time to Visually Ready, Page Load, etc.). This forces organizations to focus on optimizing Chrome Mobile performance, which is substantially more challenging due to the diversity in the Android device and OS population. As well, without a proven business reason, getting customers to update their mobile performance experience based on Core Web Vitals data could become challenging once this exception is realized.
  • Exclusion of SPA Soft Navigations. Up until recently, none of the Core Web Vitals metrics were captured for SPA Soft Navigations (see below for changes to Cumulative Layout Shift). This is understandable as the focus for Google is the performance of pages originating from Google Search Results, and navigating from the results will not generate a SPA Soft navigation. However, the performance and experience advantages of SPA Soft Navigations for visitors is almost completely lost to Core Web Vitals.
  • Current Lack of Clear Links Between Core Web Vitals and Business KPIs. Google has been emphasizing the Core Web Vitals as the new the new metrics that companies should use to guide performance decisions. However, there has yet to be much (or any) evidence that can be used to show organizations that improving these metrics leads to increased revenue, conversions, or engagement. Without quantifiable results that link these new performance KPIs to improvements in business KPIs, there may be hesitancy to drive efforts to improve these metrics.

Google is, however, listening to feedback on the collection of Core Web Vitals. Already there have been changes to the Cumulative Layout Shift (CLS) collection methodology that allow it to more accurately reflect long-running pages and SPA sites. This does lead to some optimism that the collection of Core Web Vitals data may evolve over time so that it includes a far broader subset of browsers and customer experiences, reflecting the true reality and complexity of customer interactions on the modern web application.

Exposing the Core Web Vitals metrics to a wider performance audience will lead to customer questions about web performance professionals are using this information to shape performance strategies. Overall, the recommendation thus far is to approach this data with caution and emphasize the current focus these metrics have (affecting Page Rank results), the limitations that exist in the data collection (limited browser support, lack of SPA Soft Navigations, mobile data only from Android), and the lack of substantial verification that improving Core Web Vitals has a quantifiable positive effect on business KPIs.

The Performance Implications of Android Dominance

When working with customers in Europe or who serve their data in the US and Europe, I am stunned when they ask why their performance is so much slower in certain European countries compared to the US.

Glimpsing at some publicly available stats (thank you Statcounter!), the reason is clear: Android is the dominant Mobile platform in Europe.

Mobile OS Breakdown – Europe – March 2021 to March 2022

This doesn’t hold true everywhere in Europe – in the UK (yes, it is still in Europe!), Android and iOS have nearly equal Mobile device market share.

Mobile OS Breakdown – UK – March 2021 to March 2022

But in Germany, the divide is vast, with Android clearly dominating the playing field.

Mobile OS Breakdown – Germany – March 2021 to March 2022

But there is yet another divide that is greater than even the Android/iOS split – the Android version difference. Depending on the country, your performance could be dependent entirely upon the versions of Android that the visitors use.

Starting with Germany in Q1 2022, Android usage is dominated by the three latest OS versions: 10, 11, and 12.

Android OS Breakdown – Germany – 2022-01-17 to 2022-03-27

But in countries like Spain and France, Android/9 is still a prevalent OS. This version of Android runs on much older hardware and is more likely to experience degraded performance compared to those running 11 or 12.

Android OS Breakdown – Spain – 2022-01-17 to 2022-03-27
Android OS Breakdown – France – 2022-01-17 to 2022-03-27

For teams trying to design performant web sites, this is a critical piece of information. While Mobile is the dominant platform, sites need to be designed to deliver excellent user experiences for all visitors. And in Europe, this means Android users.

What can you do?

  • Focus on rendering – Get your critical content and functionality on the page as quickly as possible. Items that are secondary (ads, tracking, marketing, etc.) can be delayed
  • Reduce your JS as much as possible – Older Android versions struggle with hardware limitations, so reducing the upfront JS processing will be critical
  • Optimize your images – Sounds simple enough, but using an image management service that provides the right image for the device that is viewing the content will make your site device appropriate

And, most importantly, use an Android device. If you make your development team use Android for a week, they might get the message that they need to do more to reach into this neglected Mobile population.


If you’re a browser geek like I am, check out this post I wrote in 2009 about the browser stats. The world is a very different place now.

Web Performance Trends 2013 – Third Party Services

Every site has them. Whether they’re for analytics, advertising, customer support, or CDN services, third-party services are here to stay. However, for 2013, I believe that these services will face a level of scrutiny that many have avoided up until now.

Recent performance trends indicate that while web site content has been tested and scaled to meet even the highest levels of traffic, the third-party services that these sites have some to rely on (with a few exceptions) are not yet prepared to handle the largest volumes of traffic that occur when many of their customers experience a peak on the same day.

In 2013, I see web site owners asking their third-party service providers to provide verification that their systems be able to handle the highest volumes of traffic on their busiest days, with an additional amount of overhead – I suggest 20% – available for growth and to absorb “super-spikes”. Customer experience is built on the performance of the entire site, so leaving a one component of site delivery untested (and definitely unmonitored!) leaves companies exposed to brand and reputation degradation as well as performance degradation.

In your own organizations, make 2013 the year you:

  • Implement tight controls over how outside content is deployed and managed
  • Implement tight change control policies that clearly describe the process for adding third-party content to your site, including the measurement of performance impacts
  • Define clear SLAs and SLOs for your third-party content providers, including the performance levels at which their content will be disabled or removed from the site.

When speak to your third-party content and service providers about their plans for 2013, ask them to:

  • Explicitly detail how they handled traffic on their busiest days in 2012, and what they plan to do to effectively handle growth in 2013
  • Clearly demonstrate how they are invested in helping their customers deliver successful mobile sites and apps in 2013
  • Lay out how they will provide more transparent access to system performance metrics and what the goals of their performance strategy for 2013 are.

Take control of your third-party content. Don’t let it control you.

The Rule of Thirds: The Web Performance Analyst

Blurry Man - Brian Auer - http://www.flickr.com/photos/brianauer/2929494868/

Recently, there has been a big push for the Dev/Ops culture, an integrated blending of development and operations who work closely together to ensure that poor performing web and mobile applications don’t make it out the door. They have become the rockstars of the conference circuit and the employment boards.

I fit into neither of these categories. I have never run anything more than a couple of linux servers with Apache and MySQL. I write code because I’m curious, not because I’m good at it – in fact, I write the worst code in the world and I am willing to prove it!

I am a member of a web and mobile performance culture that is language and platform independent, to use some buzzwords.

I am a web and mobile performance consultant and analyst.

I can take apart reams of data to find statistical patterns and anomalies. I believe that averages are evil, and have believed this for more than a decade. I have been using frequency and percentile distributions for almost as long and watched as the industry finally caught up.

I can link the business issue that faces your company with the technical concerns you are facing and help guide you to the middle ground where performance and the balance sheet are in careful equilibrium.

I don’t care what you write your code in. I don’t care what you run it on. Now, don’t get me wrong: I respect and admire the Dev/Ops folks I have met and know. I am just not in their tribe.

Web Performance Concepts: Customer Anywhere

Companies are beginning to fully grasp the need to measure performance from all perspectives: backbone, last mile, mobile, etc. But this need is often driven by the operational perspective – “We need to know how our application/app is doing from all perspectives”.

While this is admirable, and better than not measuring at all, turning this perspective around will provide companies with a whole new perspective. Measure from all perspectives not just because you can, but because your customers demand performance from all perspectives.

The modern company needs to always keep in mind the concept of Customer Anywhere. The desire to visit your site, check a reservation, compare prices, produce coupons can now occur at the customer’s whim. Smartphones and mobile broadband have freed customers from the wires for the first time.
If I want to shop poolside, I want your site to be as fast over a mobile connection on my Android as it is on my WiFi iPad as it is on my Alienware laptop on ethernet. I don’t care what the excuse is: If it’s not fast, it’s not revenue.

Knowing how a site performs over the wire, in the browser, around the world made “Web” performance a lot harder. The old ways aren’t enough.

How does your “Web” performance strategy work with Customer Anywhere?

Copyright © 2024 Performance Zen

Theme by Anders NorenUp ↑